


The second week of 2021 saw a significant correction in the price of Bitcoin, following the premier cryptocurrency’s frantic rally to new all-time highs. Although Bitcoin’s price has since recovered somewhat, it initially fell from a high of over $41,500 to nearly $33,000. Perhaps even more interesting is how the Ivan on Tech BSI Indicator was able to predict this Bitcoin dump several days in advance. Read on for the full breakdown of how a cryptocurrency trading indicator predicted Bitcoin’s January 2021 dump!
First and foremost, certain trading indicators sometimes ”luck out”. Nevertheless, the BSI Indicator has consistently revealed impressively accurate Bitcoin buy sell signals for the past few years. The BSI Indicator’s chief differentiating feature from other crypto trading indicators, or trading indicators in general, is that it uses both technical analysis (TA) data and on-chain analysis sentiment. Combining these two data groups in a single easy-to-use cryptocurrency trading indicator allows potential investors to understand how the cryptocurrency markets are moving more accurately. Although no single trading indicator can guarantee success, the BSI Indicator increases the likelihood of accurate predictions by incorporating technical analysis and on-chain analysis. Moreover, BSI has been helping uncover Bitcoin buy sell signals for years.
For example, the BSI Indicator identified that the crypto market was becoming acutely overbought a whole 13 days before Bitcoin’s 2017 dump from nearly $20,000 to almost $13,000. On the flip side, the BSI Indicator also began recognizing buy signals in March of 2020, over 11 days before Bitcoin technically left its bear trend and entered a bull market. During this time, Bitcoin was trading for as little as $4,500. Just imagine what an experienced trader would give to being able to get early information regarding Bitcoin buy sell signals like these days in advance.
What is BSI?
Put simply, the term BSI is short for Bitcoin Strength Index. More specifically, ”BSI” refers to the Ivan on Tech BSI Indicator. This is a cryptocurrency trading indicator that combines technical analysis with on-chain analysis, providing in-depth information for anyone looking to better understand the cryptocurrency markets.
The BSI Indicator is a proprietary trading indicator that features TradingView integration. Although this indicator is developed specifically with Bitcoin trading in mind, it can be also be used on other assets listed on TradingView. BSI combines short term trends in the market with long term trends and, perhaps most importantly, on-chain sentiment – allowing users to understand what is going on on-chain before this actually plays out in the charts.
Just the latest real-life success example of how the BSI Indicator can reveal market actions came in the past week, when it managed to predict Bitcoin’s fall from its all-time high price of over $41,500. So, how was this cryptocurrency trading indicator able to successfully predict real-world market events, and why is it able to do this over and over? Read on for the full breakdown of how the BSI Indicator was able to reveal its most recent successful Bitcoin prediction!
Bitcoin’s January 2021 Dump
First, we should give some context to Bitcoin’s dump in early January of 2021. Even if you haven’t been following the cryptocurrency markets closely, you will likely know that Bitcoin has been reaching new highs recently. The late 2020 Bitcoin bull run saw the price of Bitcoin surpass its previous all-time high from 2017 of roughly $20,000. In fact, on January 1s, 2021, the price of Bitcoin broke north of $29,000. Although this already trumped Bitcoin’s previous all-time high by nearly 50%, the Bitcoin rally didn’t subside.

Rather, Bitcoin would continue to ride this parabolic move in the following days. On January 8th, the price of Bitcoin surged past the psychologically important $40,000 barrier, meaning Bitcoin’s price had doubled in roughly three weeks. What’s more, this came following an impressive Bitcoin rally over the last part of 2020, which brought Bitcoin’s price from roughly $5,000 in March of 2020 to nearly $30,000 by the end of 2020.
In short, Bitcoin was looking bullish on January 8th. The last few weeks’ bull run had opened a lot of investors’ eyes to the cryptocurrency market, and the crypto market had matured substantially since late 2017. Nevertheless, the price of Bitcoin then took an abrupt nosedive almost overnight.

On January 11th, when the dust had settled, the price of Bitcoin had fallen from a high of over $41,500 to nearly $32,000 in just a matter of days. As such, nearly a fourth of Bitcoin’s market capitalization had been wiped out in a brutal January 2021 dump. Bitcoin’s price has since recovered somewhat, but Bitcoin’s massive dump remains the arguably most notable crypto market event so far in 2021.
However, what if there was a cryptocurrency trading indicator predicting this Bitcoin dump days before it took place? Enter the BSI Indicator.
How the BSI Cryptocurrency Trading Indicator Predicted Bitcoin’s January 2021 Dump
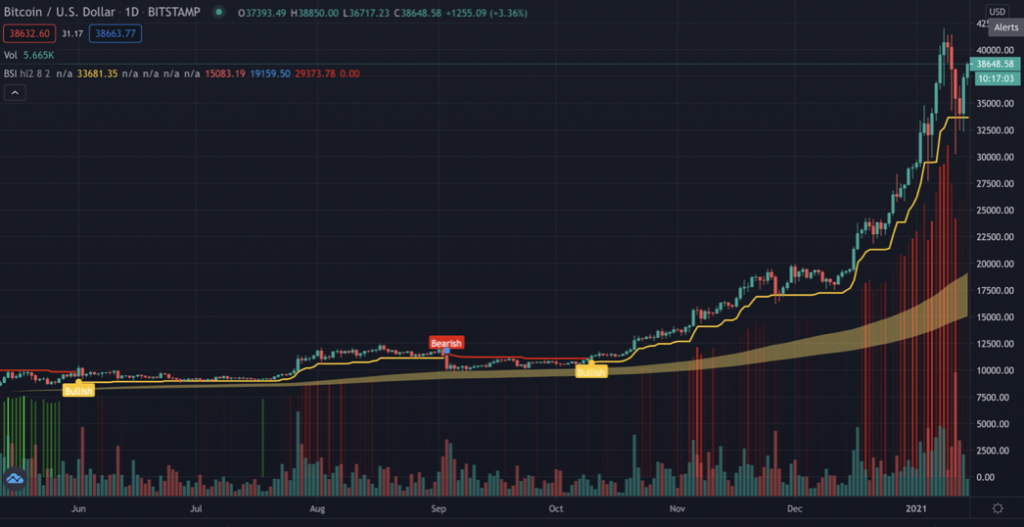
So, how did the BSI Indicator predict Bitcoin’s January 2021 dump? The answer is relatively simple. The following screenshot shows how the BSI Indicator predicted Bitcoin’s January 2021 price dip. Perhaps you already understand what you are looking at and are already planning to purchase the BSI Indicator to get access to these metrics to better predict future market events. However, for those of you looking to learn more about the details of exactly how the BSI Indicator predicted Bitcoin’s 2021 dump, read on!
Let’s begin to understand this by taking a closer look at the BSI Indicator. If you feel you need an introduction to Technical Analysis, that course – and dozens of others – is available on Ivan on Tech Academy. The BSI Indicator works by combining technical analysis and on-chain analysis in a single trading indicator. As such, you will be able to view a lot of different information with the BSI Indicator. The three most key features for cryptocurrency trading given by the BSI Indicator are the following:
- BSI Short-Term Trend
- BSI On-Chain Sentiment
- BSI Cloud
BSI Short-Term Trend
The BSI Short-Term Trend allows you to see when the short-term trend of your chosen cryptocurrency changes between being bullish and bearish. In the picture included above, the is seen as the thin red or yellow line. When the line is yellow and appears as support for the price, the trend is bullish. When the line is red and appears to act as resistance, the short-term trend is bearish.

BSI On-Chain Sentiment
On the other hand, BSI On-Chain Sentiment can be seen as the green and red stripes printed underneath the price candles. These indicate whether the market is overbought or oversold. Green lines indicate when the market is oversold (and subsequently when there is an opportunity to buy comparatively cheaply), and red lines indicate when the market is overbought. As such, the BSI On-Chain Sentiment can be a powerful Bitcoin buy sell signal, seeing as it shows when the market is becoming overbought or oversold, signaling a trend reversal.
BSI Cloud
Lastly, the BSI Cloud is a tool for finding long-term trends in the cryptocurrency market. The BSI Cloud is able to identify either underlying long-term support for Bitcoin in bullish markets or long-term resistance in bearish markets. The BSI Cloud is visible as the yellow streak underlining the overall price action in the image above. As you can clearly see, the BSI Cloud swarm functions as a ”floor” or support for the asset’s long-term price action, in this example, Bitcoin. In a bearish market, the BSI Cloud can instead turn red and then reveals a long-term resistance level, which the asset will struggle to break out of.
BSI On-Chain Sentiment Flashed Red Before January 2021 Dump
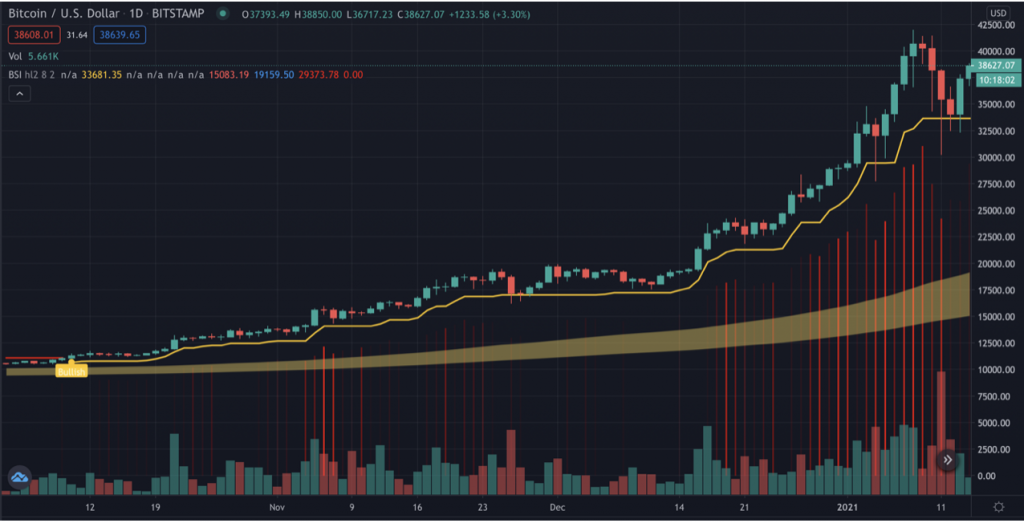
If you revisit the image of the BSI Indicator before the significant price drop on January 10th and January 11th, you will see that the BSI On-Chain Sentiment flashed red before the dump. In fact, the on-chain indicators were signaling that Bitcoin was becoming significantly overbought for days before the dump actually took place.
When an asset becomes overbought, this is a good indicator that its price is peaking. Put simply, being overbought means an asset becomes overvalued in the short term, as buying pressure pushes up the price of the asset over what the market decides is its current ”intrinsic value”. It is important to remember to take this concept with a pinch of salt, as an asset can be overbought in the short term despite being below its fair market value.
Conversely, when an asset is oversold, selling pressure is pushing the price below what the market has decided is an asset’s current intrinsic value. These on-chain indicators do not always indicate a sharp drop or rise in an asset’s price, but they are nonetheless important to keep in mind. What’s more, the clearer on-chain sentiment signals overboughtness or oversoldness, the more likely is it that a price correction is imminent.
The BSI Indicator’s On-Chain Sentiment began flashing red, signaling that Bitcoin was becoming overbought in late December 2020. However, these signals were not entirely clear. As you can see in the attached screenshot of the cryptocurrency trading indicator, the on-chain sentiment of overboughtness became much clearer in early January 2021, as the stripes became more intensely red, revealing a stronger overbought signal. This, in turn, was a strong Bitcoin buy sell signal – namely that investors should, in this situation, consider selling as the market was becoming increasingly overbought. With that said, your trading decisions should also be based on what timescale you are making your investments on.
Is BSI the Best Indicator for Cryptocurrency Trading?
In general, the specific cryptocurrency trading indicator that works best for you will depend on your trading strategies. However, many will find that the BSI Indicator is the best indicator for cryptocurrency trading for them. The major reason for this is how the BSI Indicator combines technical analysis with on-chain analysis.
Combining on-chain analysis with technical analysis in an easily-understood trading indicator allows users and traders to get a holistic overview of the cryptocurrency market. Consequently, the BSI Indicator allows them to access on-chain data that would otherwise be hard to get access to and understand. What’s more, through incorporating traditional technical analysis in the cryptocurrency trading indicator, users can cross-reference Bitcoin buy sell signals based on both technical analysis and on-chain analysis.
In the end, no single trading indicator is without risk. However, the best indicator for cryptocurrency trading is, without a doubt, the one that gives its users access to the most relevant information to base their trading strategies on. The BSI Indicator is not a trading strategy in its own right – however, it is a valuable tool for getting unique insight into the cryptocurrency market. Seeing as the BSI Indicator is the only major cryptocurrency trading indicator to combine technical analysis with on-chain analysis, calling it ”the best indicator for cryptocurrency trading” is consequently justified.
Additionally, the BSI Indicator did not just predict Bitcoin’s January 2021 dump. Rather, the BSI Indicator consistently reveals Bitcoin buy sell signals that users without access to a combined technical analysis and on-chain analysis indicator will miss. Specifically, the BSI Indicator has been able to reveal every major Bitcoin buy sell signal over the past few years. Explore it yourself and get more information from the arguably best indicator for cryptocurrency trading!
BSI Indicator Summary
In summary, it is clear that the BSI Indicator’s novel way of combining technical analysis with on-chain analysis helps it reveal market trends and potentially predict market performance. The powerful features available in the Ivan on Tech BSI Indicator, together with the on-chain analysis integration, means it could arguably be called one of the best indicators for cryptocurrency trading from a technical standpoint.
Essentially, combining technical analysis and on-chain analysis allows users to realize serious signals in the market. For example, when on-chain sentiment is flashing bright green and technical analysis turns yellow or bullish, this should be seen as a significant buy signal. On the other hand, seeing both a bearish – or red – technical analysis trend and red on-chain sentiment should be an equally significant market signal for caution. Additionally, the BSI Indicator has been able to predict a number of market events successfully, ranging from major shifts to smaller ones.
Moreover, this most recent example of the BSI Indicator’s success is far from the first time this has happened. Instead, the BSI Indicator has been able to discern countless Bitcoin buy sell signals in the past years. However, keep in mind that you need a trading, blockchain, or cryptocurrency education to make the most of these signals. Furthermore, no trading indicator can guarantee gains, and past performance does not always indicate future success.
With that said, however, access to relevant information is oftentimes crucial for being a successful trader. With the Ivan on Tech BSI Indicator, you get access to some of the most detailed relevant information for creating a trading or cryptocurrency investment strategy. Catch the next BSI webinarand hear more about the BSI Indicator, or purchase it and try it for yourself!


